How to use Prompt Tracker
Prompt Tracker monitor your brand mentions across ChatGPT, Perplexity, Google AI, and Copilot. Add or generate LLM queries, track your visibility in real time, and uncover competitor dominance and citation sources shaping AI search.
Steps to use the Prompt Tracker #
Log in to the account with valid credentials.
It navigates to the Home page.
Step 1 : #
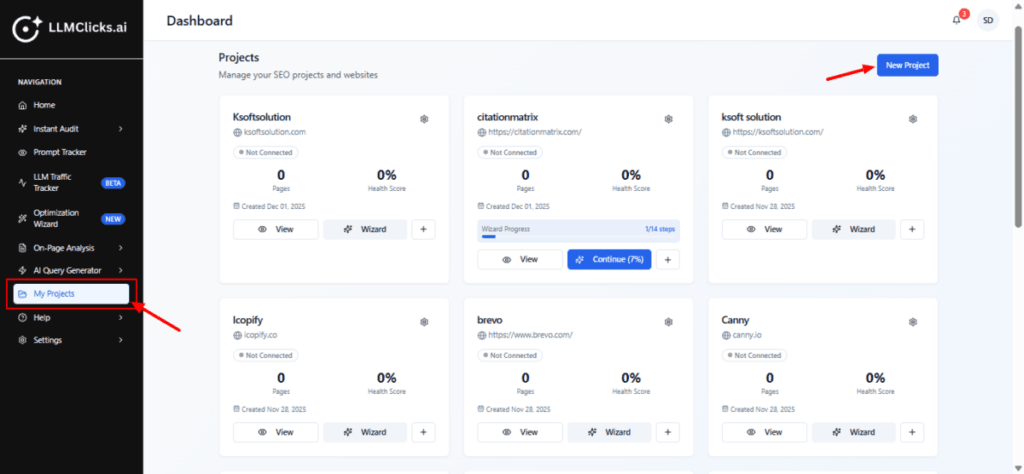
Open My Projects from the left navigation to view all projects you’ve created.
Click New Project (top-right) to start adding a new website project.
The project grid gives a quick summary of each project (health score, pages count, created date).
Step 2 : #
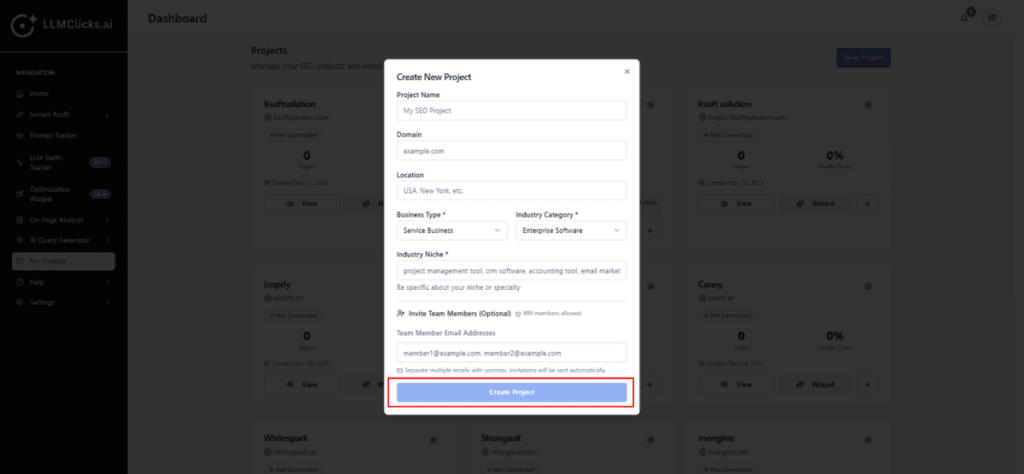
Fill Project Name and Domain (required).
Optionally set Location and choose Business Type / Industry to get targeted query suggestions.
(Optional) Add team emails to invite collaborators.
Click Create Project to add the project to your dashboard — you’ll be taken back to the project grid with the new card visible.
Step 3 : #
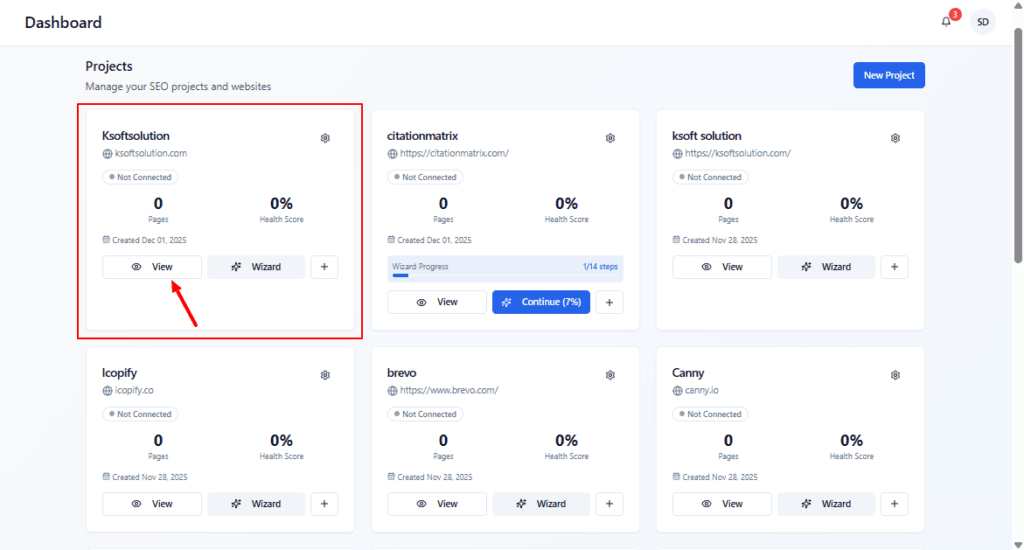
Click View to open the project dashboard where you can run audits, see pages, and review insights.
Click Wizard to run the guided setup (adds sitemaps, configures checks, and generates initial tasks).
Use the plus/menu button to connect integrations or perform additional actions (depending on your UI).
Step 4 : #
Open Prompt Tracker from the left menu.
Select the project you want to analyze from the Project Selection dropdown.
Use Executive Summary / Preview Report / Share Report to export or share results.
The active tab Keywords & Results is selected, showing immediate summary tiles (Total Queries, Brand Found, Not Found, Success Rate, Your Links).
Click Add Queries to add more prompt queries to be tested.
Use Recheck Queries to re-run the selected queries across the active AI platforms (useful after site updates).
Click Export CSV to download the raw results for offline review or reporting.
Use Query Results to inspect each prompt and see which platforms returned your brand.
For queries where your brand is Not Found, add/edit site content or create targeted pages.
Use the platform-by-platform breakdown to see which AI systems recognize your brand better.
Open Analytics to see aggregated performance of your prompts.
Use the Query Results Overview chart to quickly spot how many queries returned your brand vs. didn’t.
Review Business Analysis Summary to understand competitor frequency and overall visibility health.
Use the summary statistics to prioritize next actions (e.g., generate more queries, improve pages).
Go to Business Analysis to see which businesses AI frequently lists for your queries.
Switch between Card view(visual tiles) depending on how you prefer to scan results.
Use the frequency and coverage data to identify competitors to target or pages to build/improve.
Go to Business Analysis to see which businesses AI frequently lists for your queries.
Switch between List view (ranked bars) depending on how you prefer to scan results.
Read the summary tiles first to understand overall citation volume, uniqueness, and coverage quality.
Use the Citations by Platform chart to identify which platform is most likely to surface your brand or competitors — a high bar = more mentions and more influence.
If ChatGPT shows many citations but your brand is missing, focus optimization on content types ChatGPT prefers (rich answer pages, FAQs, clear structured data).
Use the pie chart to quickly see whether citations are concentrated in a few domains or spread widely — concentration suggests a few dominant references.
Hover a slice to view the exact count for any domain.
Check the frequency histogram to understand coverage breadth: a large “1 time” bar means many single-mention sources; more 2–5 or 10+ bars indicate repeat authority.
Actionable step: If your brand or pages appear infrequently, prioritize content or listings that match the high-frequency paths shown here.
Spot the top sources AI references for your queries — these are authoritative sites driving answers.
Check High-Frequency Sources to find which publishers consistently appear and consider whether you should target or displace them.
Compare platforms (Platform Performance) to see which AI gives you the most citations — high counts mean more opportunity to appear.
Review Citation Quality to confirm citation reliability; follow any recommendations to raise quality/consistency.
Search or filter: Use the search box or the platform dropdown to narrow sources (e.g., show only ChatGPT results).
Sort: Change the Sort by dropdown to show top-frequency sources first so you see the most-cited sites.
Expand a source row: Click the chevron/row to expand it — this reveals Related Queries that produced that citation (helps map which queries point to which sources).
Inspect frequency & platform: Note the “4x” frequency and platform tag to understand how often and where the source appears.
Open the source: Click the Open Source icon to review the cited page — check the content that caused the AI to reference it.
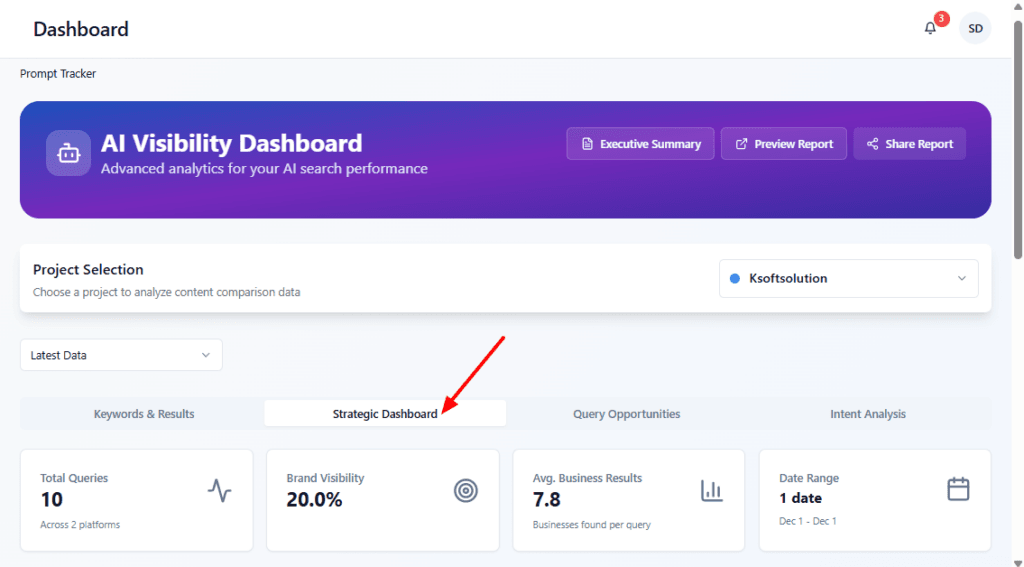
Step 5 : #
Select the project you want to review from Project Selection to load the right dataset.
Read the top tiles for a quick health check: how many queries were tested, current brand visibility percentage, and average businesses returned per query.
Confirm Strategic Dashboard is the active tab when you want a concise executive view; switch to Keywords & Results or Query Opportunities for deeper analysis and specific action items.
Use these KPIs to decide whether to re-run queries, add more queries, or export the executive summary for stakeholders.
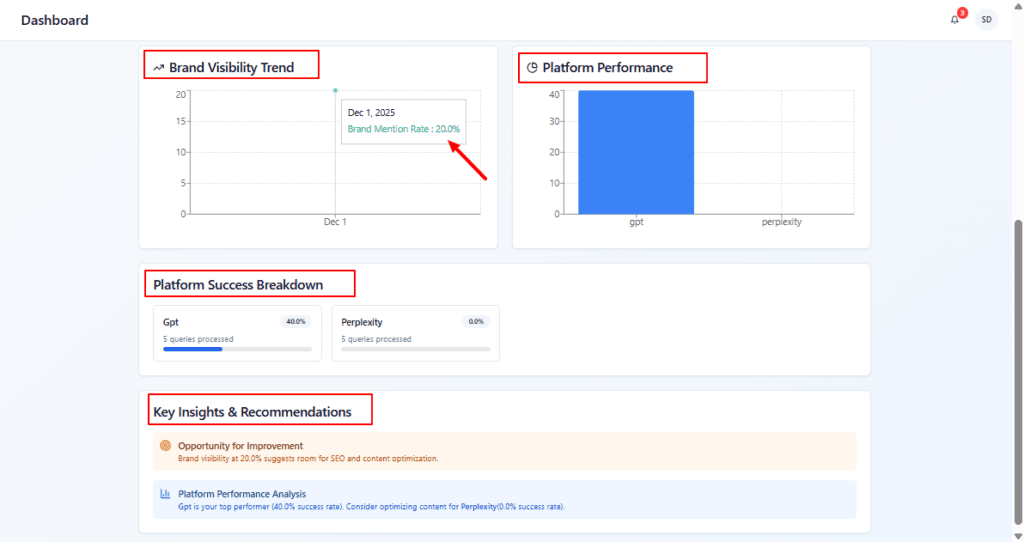
Check Brand Visibility Trend first to see whether your brand mentions are increasing or dropping — use the hover values to get exact rates for specific dates.
Use Platform Performance to quickly identify which AI platform currently favors your brand; prioritize content changes for platforms with low performance.
Look at Platform Success Breakdown to understand per-platform hit rate and how many queries were tested — this tells you where to focus tests.
Read Key Insights & Recommendations for prioritized next steps (e.g., create missing pages, optimize content for a specific platform). Use these as your tactical to-do list.
Step 6 : #
Make sure the correct Project is selected (right) before running Query Opportunities.
Click Connect to link Google Search Console — this enriches mappings and improves the accuracy of suggested Target Page matches.
If GSC is connected, the tool can suggest existing pages for opportunities automatically (reduces manual mapping).
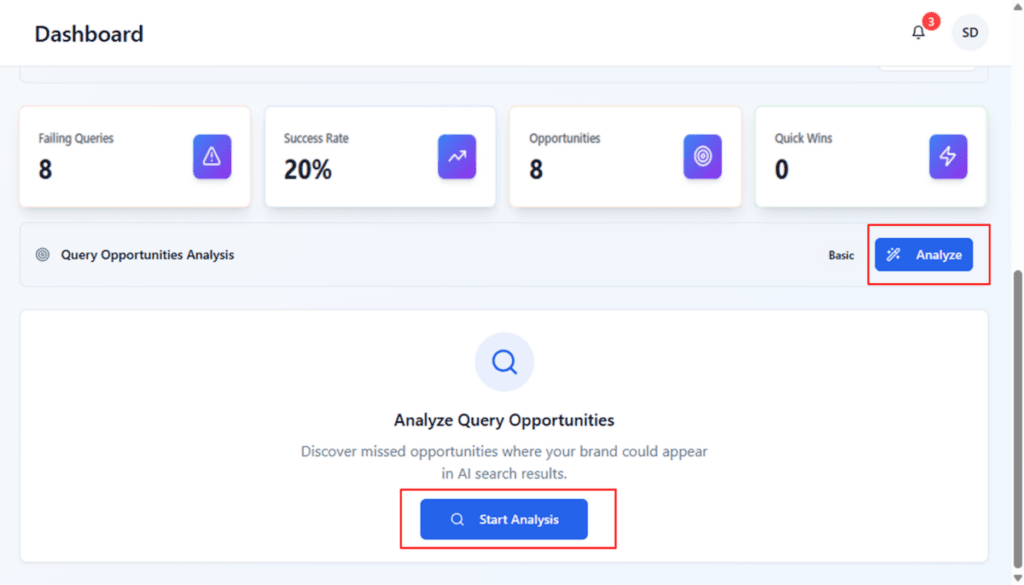
KPI tiles below (Failing Queries, Success Rate, Opportunities, Quick Wins) reflect current analysis state.
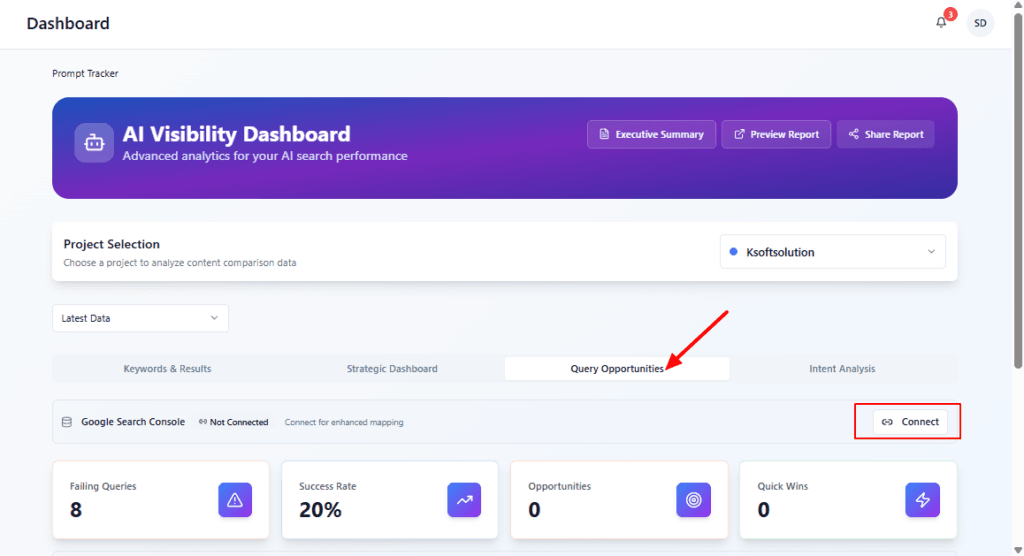
Review the KPI tiles to understand how many queries are failing and how many opportunities were detected.
Click Analyze (or Start Analysis) to run the Query Opportunities engine — it will scan platform outputs and suggest pages and tasks.
After analysis completes, return to the opportunities list (first image) to review and action the results.
If results look unexpected, re-run after publishing target pages or adjusting site structure.
Click Re-analyze to refresh the opportunity list after you’ve published new pages or updated content.
Scan the Intent / Confidence columns to prioritize: high-confidence commercial queries are higher value.
For each row, click Select page… under Target Page to map an existing page (or create a new one) to that opportunity.
Open Tasks (the suggested count) to view recommended actions (e.g., create content, add schema).
Use the Actions column to jump to deeper analysis or export tasks for your team.

Treat the toast as a quick, transient confirmation — no action required.
If you missed details, click View Project Tasks from the main modal or navigate to the Tasks page manually to inspect created tasks.

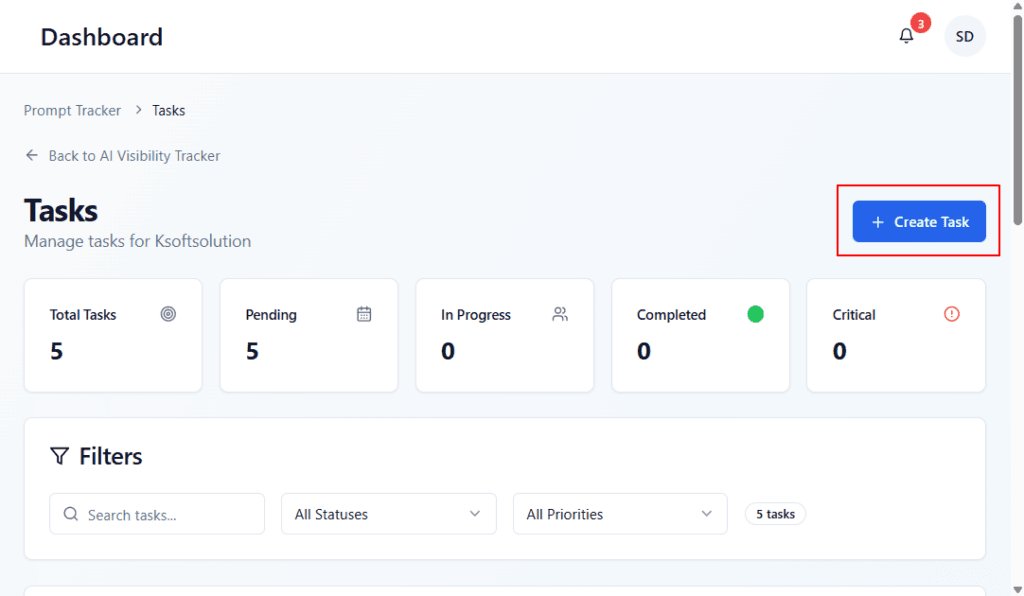
Read the summary tiles to understand overall task workload and status distribution.
Use filters to narrow tasks by status or priority.
Click Create Task to open a blank task form and add a new item (title, description, assignee, priority, due date).
After creating tasks, they appear in the list and update the summary tiles.
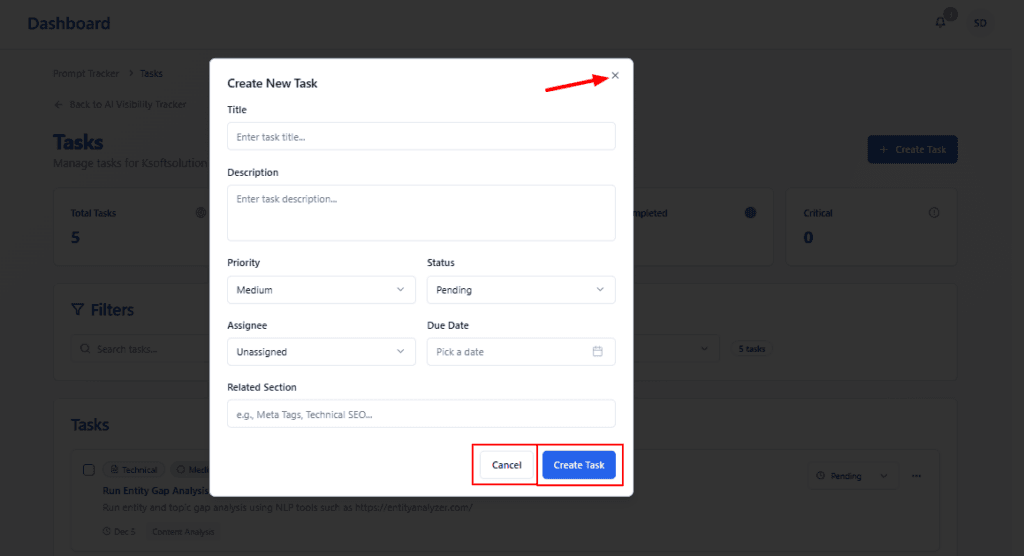
A modal titled Create New Task for adding a new project task.
Form fields visible: Title, Description, Priority, Status, Assignee, Due Date, and Related Section.
Highlighted controls: the modal Close (X) at top-right, and the action buttons Cancel and Create Task at the bottom.
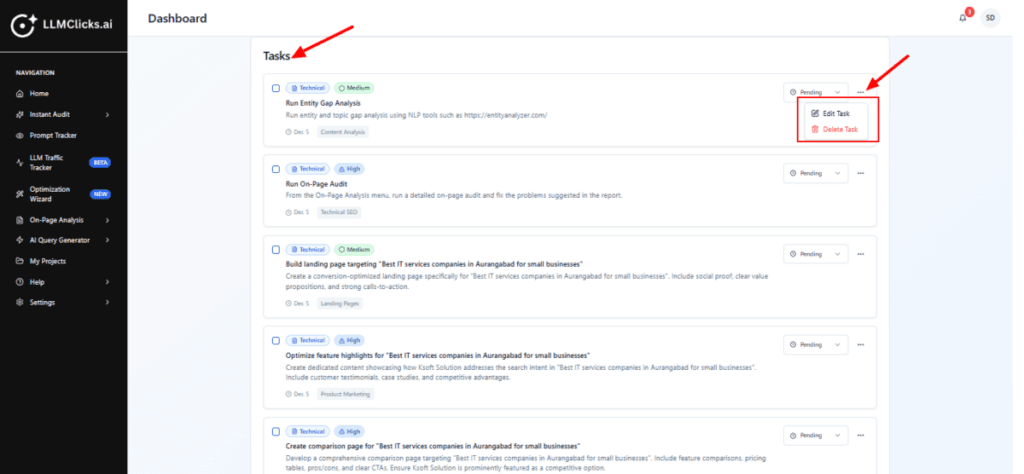
Scan the list to review pending tasks and priorities at a glance.
Use the status dropdown on the right of a row to quickly change a task’s state (Pending, In progress, Completed)
Click the kebab (three dots) to open the action menu, then choose Edit Task to update details or Delete Task to remove it.
Use checkboxes (left) to select multiple tasks for bulk actions (if available).
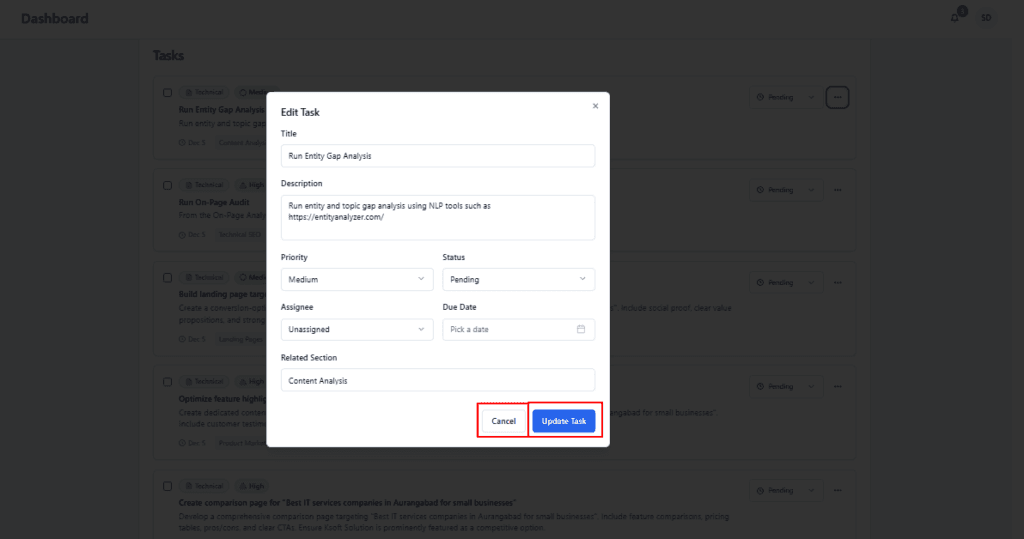
Change the Title or Description to make the task clear and specific.
Set Priority (Low/Medium/High) and Status (Pending / In Progress / Completed).
Assign the task to a team member in Assignee and add a Due Date if needed.
Use Related Section to tag the task to an analysis area (e.g., Content Analysis).
Click Update Task to save changes or Cancel to discard.
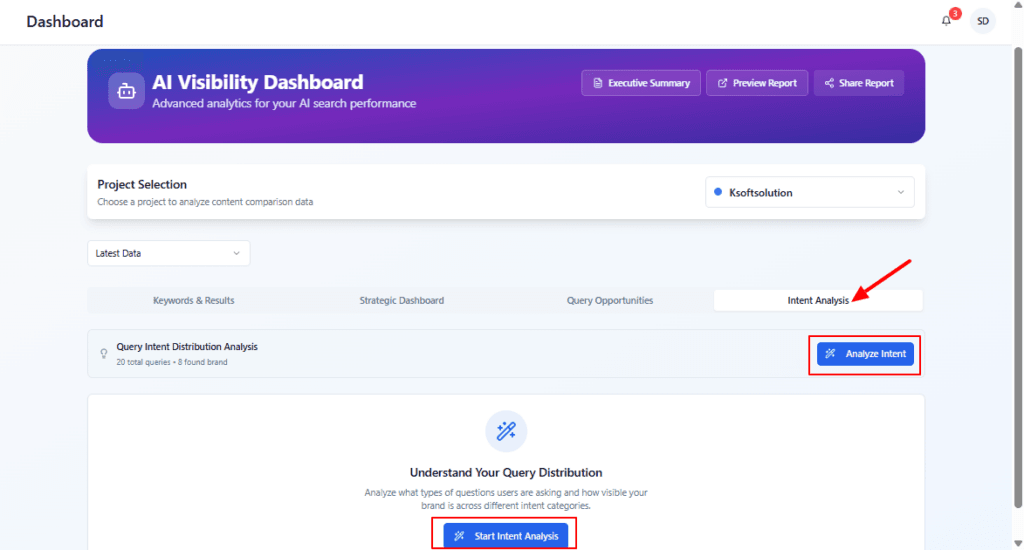
Step 7 : #
Select the project and time window (if applicable), then click Analyze Intent or Start Intent Analysis to begin.
The system will classify each query into intents and produce the visualizations and summary (the screens above).
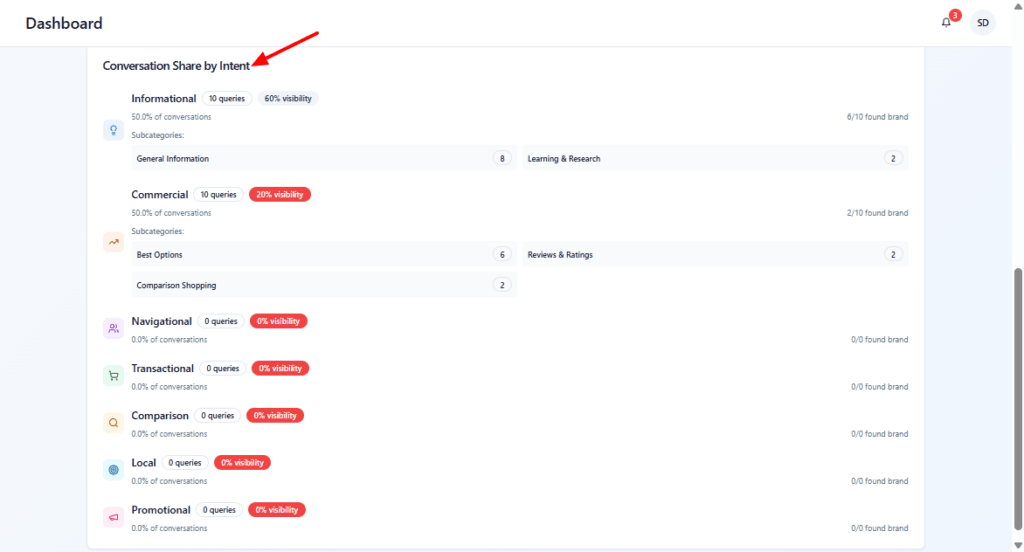
After the analysis finishes, review the Conversation Share by Intent and use Re-analyze whenever you update queries.
Use the summary to get a quick distribution snapshot and validate whether your query coverage leans more toward brand-building (Informational) or conversion (Commercial).
Click Re-analyze when you’ve updated the dataset (added/removed queries or connected a new data source) to refresh the intent breakdown.
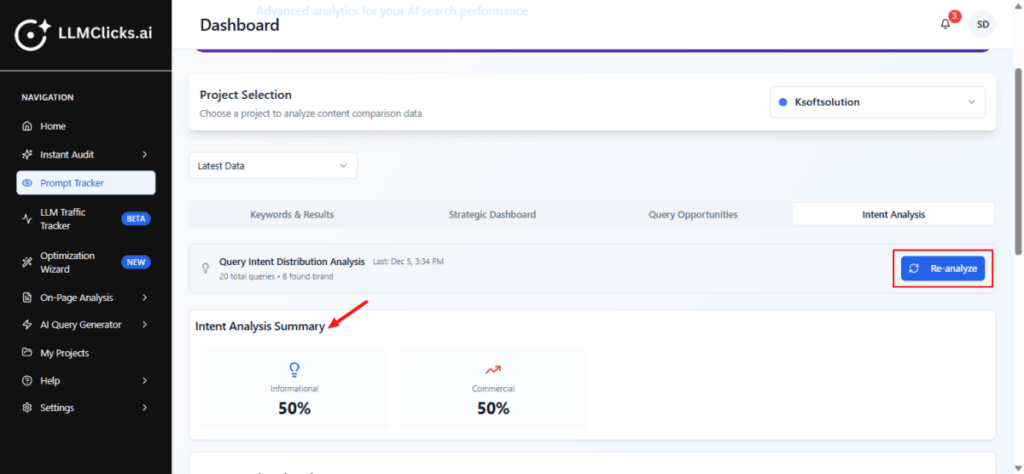
Review each intent to understand where your brand is visible (higher visibility %) and where it’s missing.
Focus first on intents with many queries but low visibility (e.g., Commercial with 20% visibility). Those are high-impact opportunities.
Click any subcategory or query in the list (if interactive) to jump to example queries and source results.